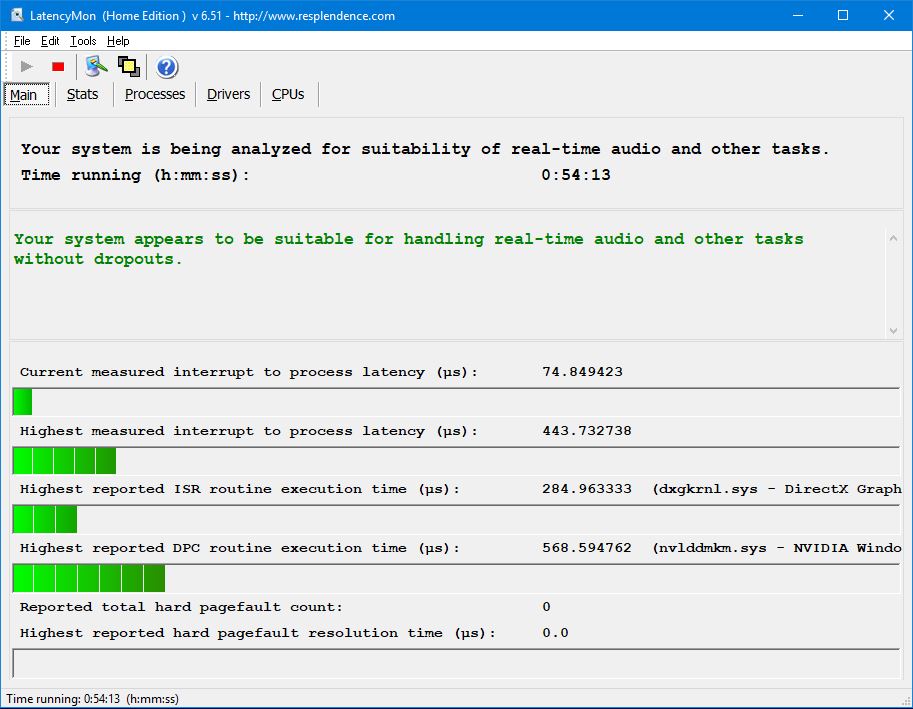
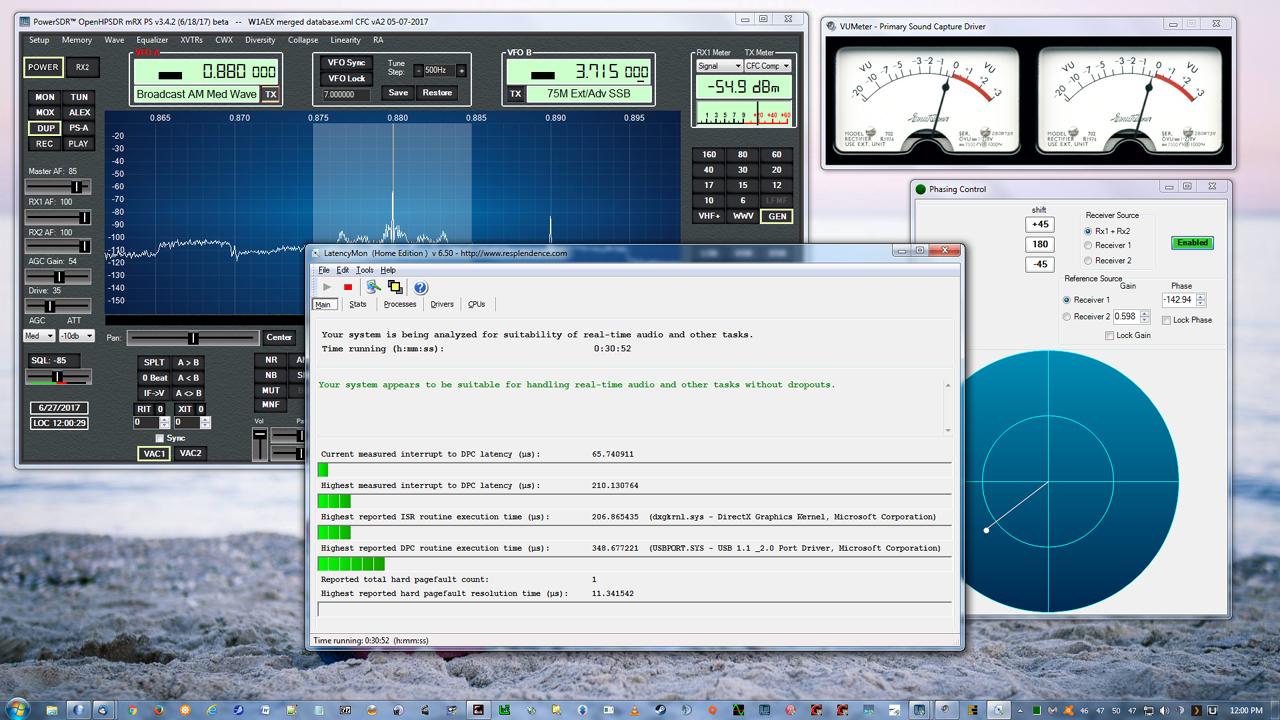
I did not realize that this thread had gone into page 2 when I posted my last response so I did not see Scott’s or your last response before I posted. Sorry to hear that you have the dreaded latency issue. However, if it’s not causing drops or pops, resolution is more a matter of seeking perfection than necessity. But I have latency OCD so I’m not one to suggest that any one shouldn’t chase this thing down and put a stake through it. I think you will be disappointed with the info you will get from Google. Other than updating your drivers, most of the information is so generic and unspecific to your build and software environment as to be basically worthless.
As mentioned, I am currently using Windows Performance Analyzer (WPA) to trace this. It’s a time-consuming and complex process. You can’t run the recorder too long as the files become huge and unmanageable. So, I had to keep running the recorder while all potential problem software was running as well as latencyMon (LM) and dump the data if I didn’t see an interesting event within one minute. After about 10 minutes in on 7/19, DPC latency jumped to early red and I captured it in about 31 seconds of data. I processed it and will show you in some screen shots what I found. Again, every different build and software environment will probably show something different, but if you download and run WPA, you can get a pretty good idea what your specific issues are. The first screenshot is of the entire 31 second recording. I arranged the data to show GPU and CPU usage in detail. I could see from the other graphs that nothing interesting was happening in storage, power or memory. The event occurred at about 18.5 seconds in and is pretty obvious in the graph.

- ScrnShot 2.jpg (445.2 KiB) Viewed 46720 times
The second shot shows the mouse hovering in the center of the event generating a horizontal line through both graphs which indicates that (a) Firefox was the process involved and (b) it did not cause a spike in CPU usage, only in GPU activity under rendering. That wasn’t a huge surprise since I am using a Xeon E5 2699 v4 with 22 cores, so it takes a serious anomaly to get its attention.

- ScrnShot 3.jpg (448.93 KiB) Viewed 46720 times
The next shot shows (in the blue spikes) an “unknown” process is generating some GPU activity/latency due to “memory transfers.” I have no idea exactly what that means but I note that there is no unusual system RAM data so I assume that is in the graphics GDDR.

- ScrnShot 4.jpg (442.63 KiB) Viewed 46720 times
The next shot shows the fairly large amount of time that was involved in rendering in Firefox at the inception of the event. It is about 60% of all the rendering time used by Firefox in the entire 31 seconds of the recording, so A LOT! Hence, the DPC spike.
The last shot shows the comparative highest amount of time involved in the mystery “memory transfer” issue. It suggests that is not the problem, whatever process is causing it.
So, what do I know now that I didn’t before? Microsoft Edge will become the only browser up when I’m running HPSDR.


